Spatial Visualization Training
Spatial visualization courses and training from eGrove Education is proven to increase spatial visualization skills for all levels. Spatial visualization training has been shown to increase retention and success in science, technology, engineering, and mathematics (STEM) fields.
Spatial skills are learnable, but many need training to improve these skills so that they are better prepared for STEM education. The Spatial Vis training software is a virtual spatial visualization course proven to increase student performance on spatial visualization standardized tests.
Sketching versus multiple-choice assignments

Freehand sketching has been shown to be especially effective when improving spatial skills. However, grading sketches is time-consuming for instructors and feedback is delayed for students.
Multiple choice is easier to grade for instructors and can be easily automated by learning management systems. However, multiple-choice is subject to the process of elimination, guessing, and they do not require students to synthesize their complete solution.
Spatial Vis software solution
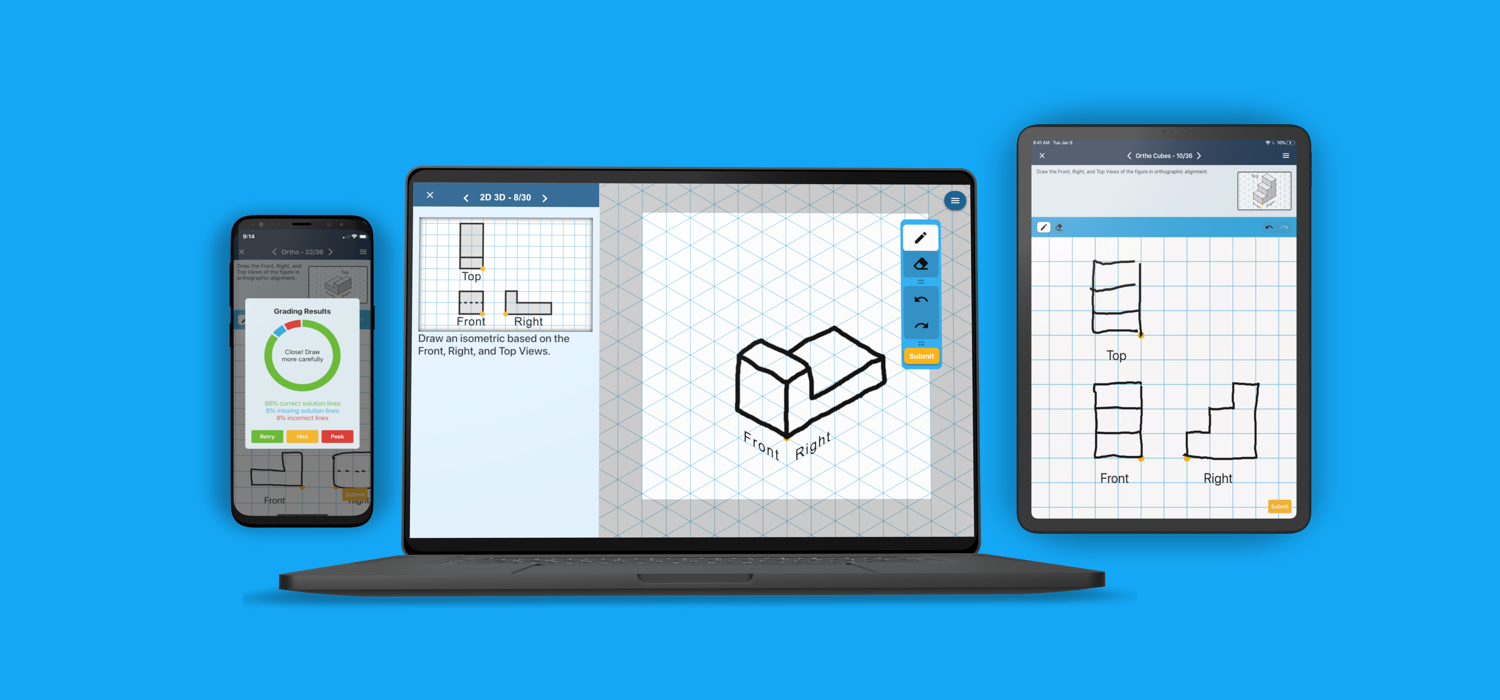
The Spatial Vis software brings together the learning benefits of sketching spatial visualization training assignments and the grading benefits of multiple-choice assignments.
Students complete digital sketching assignments on a computer, phone, or tablet, and submit their sketch to be automatically graded by the Spatial Vis grading algorithm. Students receive immediate and personalized feedback and instructors save grading time.

Increasing student persistence
Student persistence is a key attribute when increasing spatial skills. Unlike multiple-choice, Spatial Vis sketching assignments can be attempted infinite times which affords persistence.
Spatial Vis has been designed to not only allow students to be persistent but to encourage persistence and reward it. This is done through gamification and multiple levels of help options.
Spatial visualization course trials
Trials in a number of settings have been conducted using Spatial Vis. The effectiveness of the software has been measured using the Purdue Spatial Visualization Test: Rotations (PSVT:R) as a pre-test and post-test.
Students who score ≤70% on the PSVT:R pre-test are considered to be at risk of dropping out of STEM. Most of our research focuses on bringing the students in the at-risk category above the at-risk threshold.
A controlled trial in engineering classrooms

In 2017, a controlled trial was conducted at the University of San Diego in two engineering classrooms. One classroom was assigned Spatial Vis as homework to be completed remotely while the other classroom was used as a control.
Among the at-risk students who scored ≤70% on the PSVT:R pre-test, 62% of those who used Spatial Vis were no longer at risk while only 14% of the control group were no longer at risk.